
Analyze / AI-native LMS analytics
Your learning data. Answers you can act on.
Ask about your people, learning, and skills. Turn questions into charts and tables,
then dig deeper with a follow-up. No waiting for another report.
Your organization’s data, within your access, in your Upskillable workspace.
ONE QUESTION LEADS TO THE NEXT
Ask. Explore.
Ask again.
Your review doesn’t stop at the first chart. Keep exploring the result in the format you need.
240 enrollments across four courses. Here’s the breakdown by learning status.
Enrollment progress
By course and learning status
INSIDE ANALYZE
See Analyze at work.
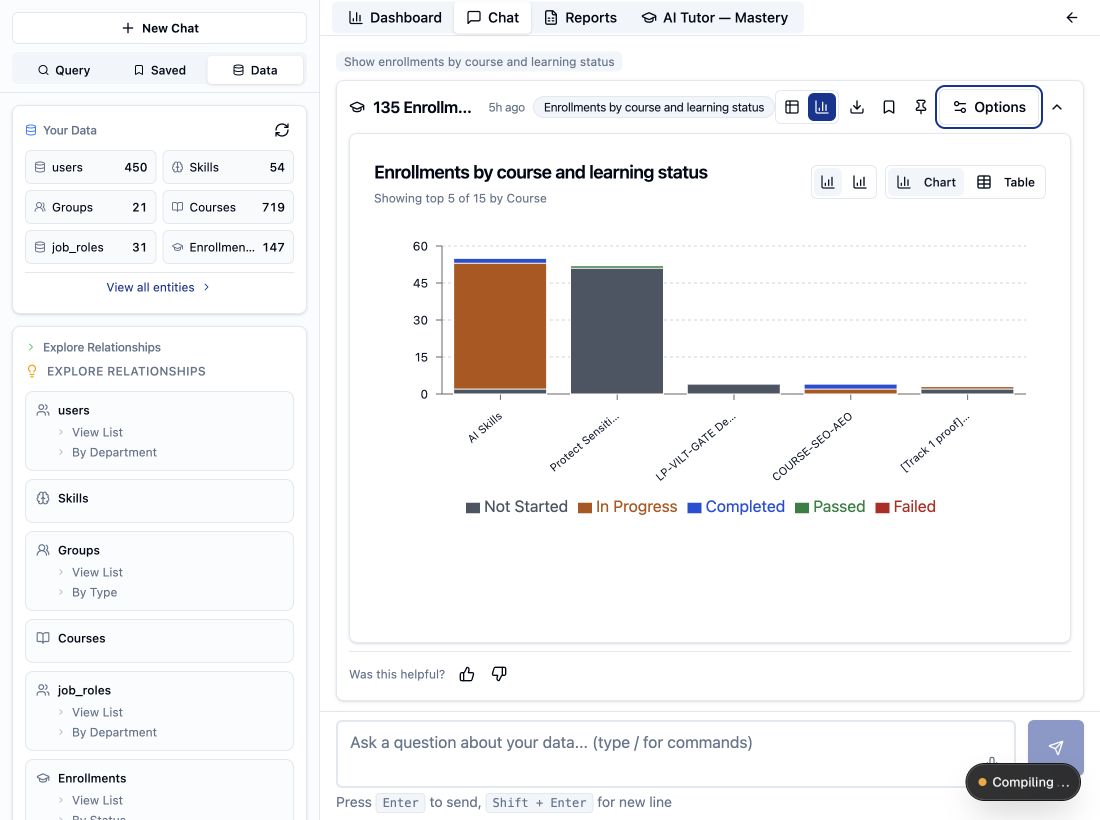
Here’s Analyze answering a real question in our local demonstration workspace. The question, chart, and data explorer are captured directly from the product.
01 / START WITH THE QUESTION
Which question needs an answer?
A course is underway. Who has started? Which teams need support? Ask about the learning, skills, and workforce records available in your workspace.
- Learning progress
“Show enrollments by course and learning status.”
See how participation is distributed across your courses. - Skills
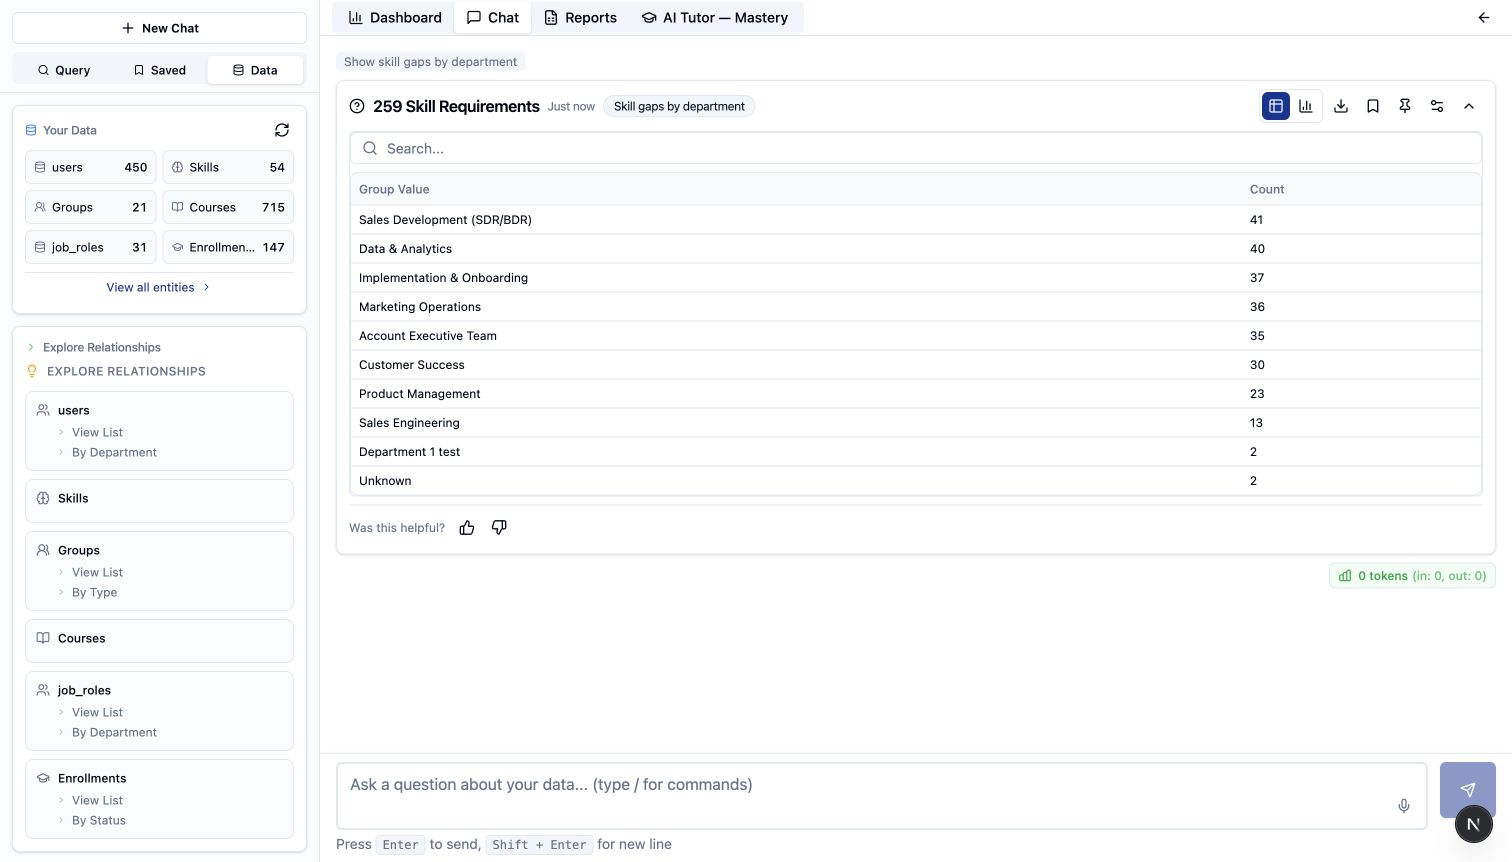
“Show skill gaps by department.”
See skill requirements that need attention. - Required training
“Show overdue enrollments.”
Find assigned learning that has passed its due date.
Who is behind the numbers?
“Show employees by department.”
180 employeesIllustrative example · Sample data02 / LOOK BENEATH THE TOTAL
Choose the view that answers your question.
A total gives you scale. A trend shows change over time. Switch between six report views to explore this illustrative learning review.
Trends
See the pattern over time.
Track new enrollments by month, rather than treating a total as a trend.
Four courses. 240 enrollments.New enrollment records per month · May–August · Total 240
Illustrative example · Sample data
Find a useful comparison.
Explore supported breakdowns by department, course, role, or learning status.
Choose the view.
Switch between a table and a chart. Use the available chart controls to change how the result is presented.
Inspect the detail.
Use the table to read the records behind a pattern.
03 / LOOK AT THE PEOPLE BEHIND THE PATTERN
A course is complete. Where do skills stand?
Course completion records progress, not skill mastery. A skills matrix helps you examine the underlying evidence. Explore learners and skills within a department, group, or role to see where development needs differ.
One team. Different development needs.
| Skill | Learner A | Learner B | Learner C | Learner D |
|---|---|---|---|---|
| Product knowledge | 3 / 3 | 2 / 3 | 3 / 3 | 1 / 3 |
| Customer discovery | 2 / 3 | 3 / 3 | 1 / 3 | 2 / 3 |
| Problem solving | 3 / 3 | 2 / 3 | 2 / 3 | 1 / 3 |
| Team communication | 2 / 3 | 3 / 3 | 3 / 3 | 2 / 3 |
Illustrative example · Sample data
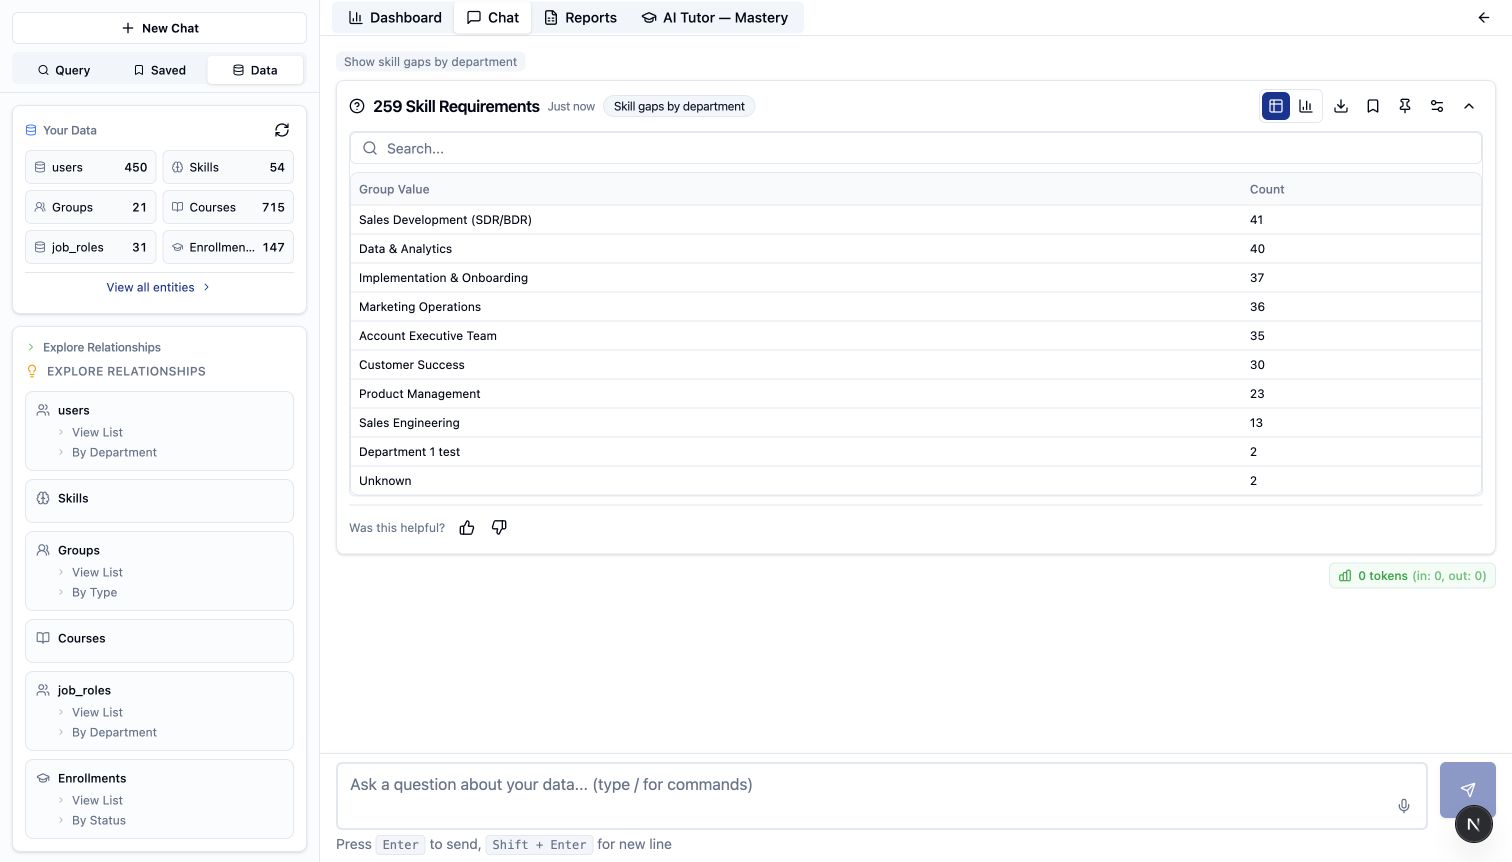
See skill analysis in the product
Choose the team.
Focus the matrix on a department, group, or role.
Read across the skills.
See learner-level differences that disappear inside a total.
Decide what to investigate.
Use the evidence to guide the next development conversation.
04 / MAKE THE OUTPUT USEFUL
A spreadsheet for the analyst. A snapshot for the meeting.
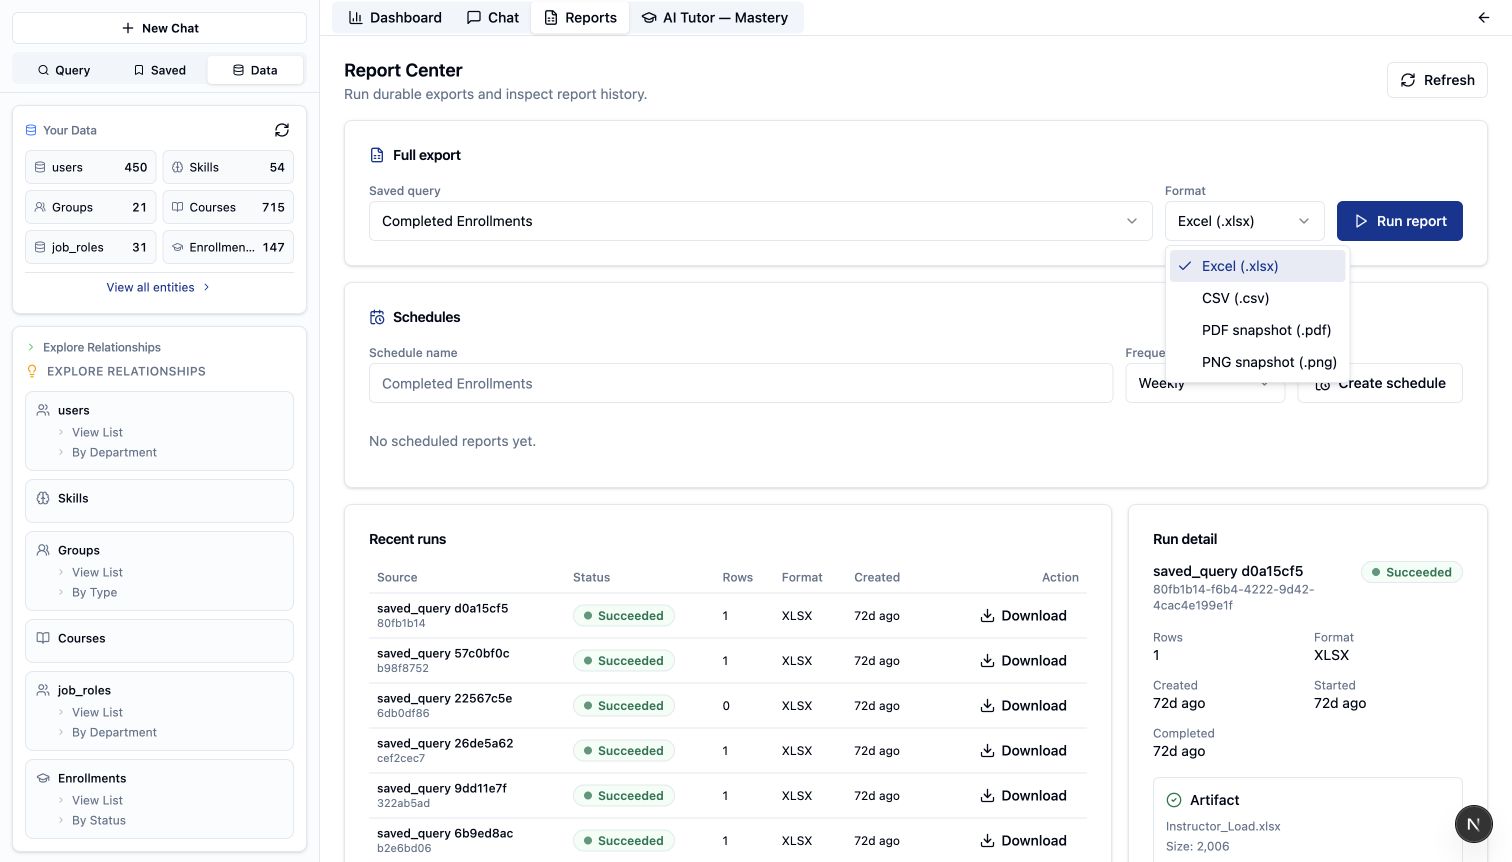
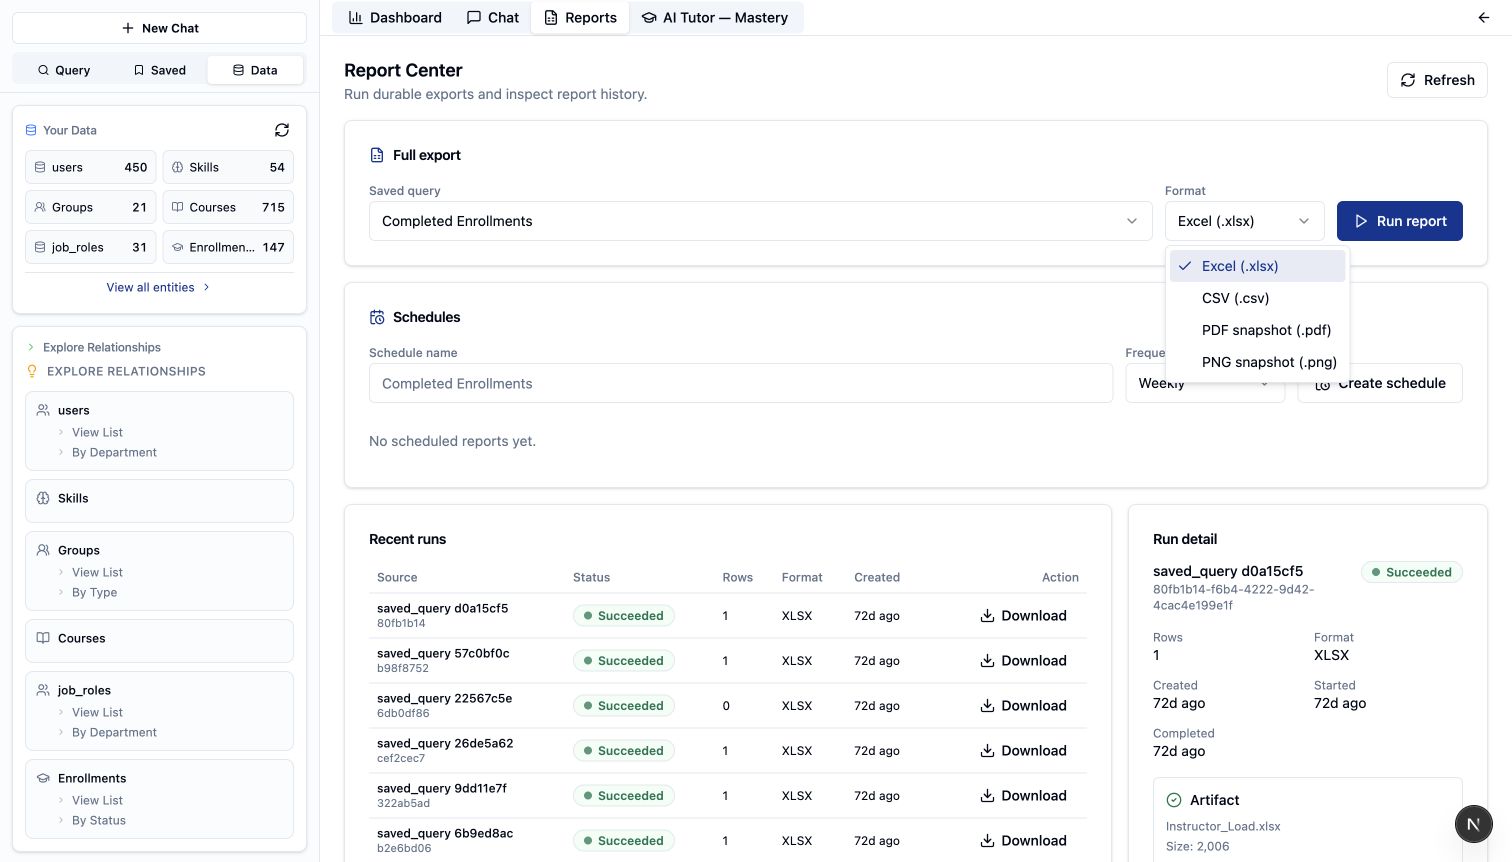
Take the underlying rows into further analysis, or bring a visual snapshot to the leadership review. Choose an available output for your report source in the Report Center.
Take the detail
into the next conversation.
A chart for the discussion. Rows for the analysis. Choose an output that fits the work ahead.
Enrollment review.csvIllustrative example · Sample dataEnrollment review
Course-level detail
- .xlsx
Excel
Spreadsheet export format.
- .csv
CSV
Rows of data for further analysis.
- .pdf
PDF
Document snapshot option.
- .png
PNG
Image snapshot option.
See export choices in the real Report Center
PART OF THE LIVING LEARNING SYSTEM
Use what you find to shape what comes next.
Use the findings to decide where learning needs attention. Revisit content in Generate Studio, review a team’s skills, or bring a specific question to the next learning discussion.
Your organization’s data, within your access.
Analyze works with supported data available in your Upskillable workspace. Results depend on the records, permissions, and scope of the question.
A FEW PRACTICAL QUESTIONS
LMS analytics, in plain language.
Do I need SQL to use Analyze?
No. Ask supported learning and workforce questions in plain language. Analyze interprets the question and presents the result in a table, chart, or key measure.
What can I explore in Analyze?
Supported data includes employees, departments, job roles, skills, courses, enrollments, and learning status. Available answers depend on the data and permissions in your Upskillable workspace.
Which report formats are available?
The Report Center offers Excel and CSV exports, plus PDF and PNG snapshots. The available output depends on the report source.
Does course completion prove someone has mastered a skill?
No. Completion is evidence of learning progress. Use it alongside relevant skills and assessment evidence when deciding what support people need.
LET’S MAKE IT CONCRETE
What would you ask your learning data?
Bring the question your current reports leave unanswered.
See how Analyze handles it with your team.